Contents
Why linear regression matters
Econometrics is the intersection between economics and statistics. It conducts statistical tests to analyse economic data.
It’s where economic theory meets reality. We can test whether economic theories stack up in the data.
The starting point for econometrics is the linear regression. This is finding a line of best fit between two variables.
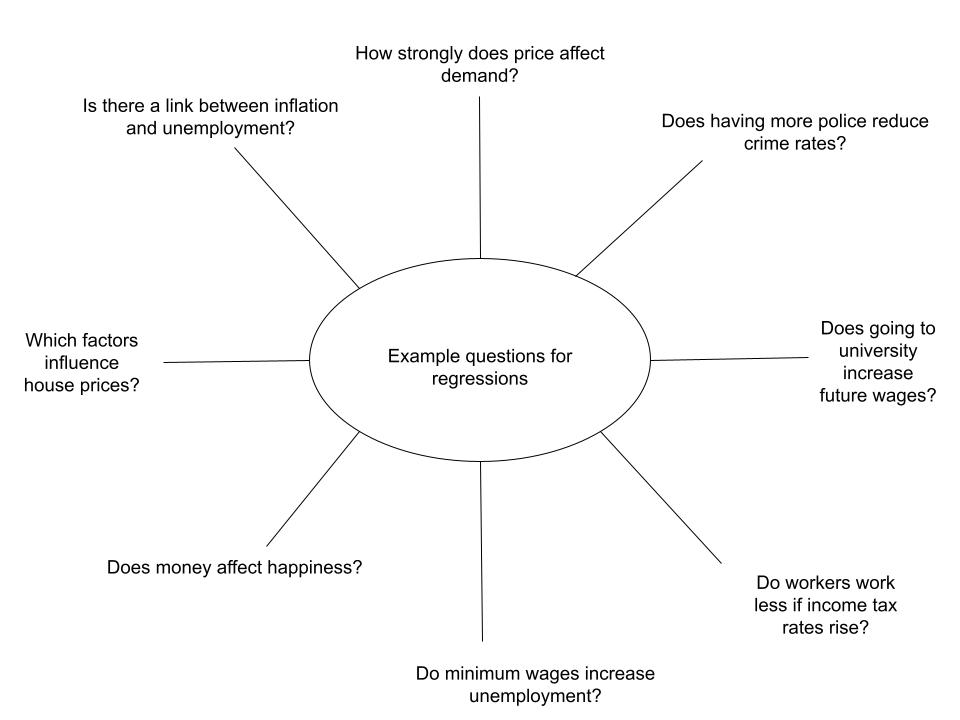
Economics is concerned with lots of questions about relationships between two variables. For example:
- What’s the relationship between price and demand? In other words is demand price-elastic or price-inelastic?
- Is the Phillips curve steep or shallow? In other words, finding the relationship between inflation and unemployment.
- How effective is monetary policy in affecting investment levels? We could look at the link between interest rates and private sector investment.

Let’s take estimating the relationship between demand and the price.
The price elasticity of demand matters for both firms and the government:
- For firms to know how to change prices to increase revenue.
- For government, when estimating the impact of taxes or subsidies. As a government economist, assumptions about the price elasticity of demand will be critical in determining the effects of micro policy. It will determine the change in quantity due to a tax or subsidy, as well as the change in consumer surplus and social welfare.
If you work as a public sector economist or in an economic consultancy, one of your tasks could be to estimate how strongly changes in price influence demand, using linear regression.
Linear regression estimates the intercept and the slope of the demand curve. This allows us to estimate the related concept price elasticity of demand.
Question:
- How would you use the data from a regression between price and quantity demanded to estimate the price elasticity of demand?
- [Hint: the PED is generally not the same as the slope of the demand curve].
The difference between linear regression and machine learning
Big technology companies, including Google, Meta, X, Amazon, Netflix and Uber will collect large volumes of data about consumers.
Often hiring econometricians or data analysts, these companies will seek to understand consumer behaviour through their big datasets.
With big data, econometricians are often employing “machine learning” methods.
Machine learning is a part of artificial intelligence that involves making statistical models. The models initially make predictions based on data and then test those predictions to refine them.
One key difference between linear regression and machine learning is that linear regression starts with an assumption about the shape of the line of best fit.
This is often that it’s a straight line but it could also be a particular shape such as a curve.
While this allows us to test particular economic relationships and make more sense of the data from a human perspective, it could lead us to miss relationships that do not fit our prior conceptions.
Yet machine learning is different. Machine learning is flexible, in that it does not make a prior assumption about what type of function to use.
Instead, machine learning uses regression trees to search across all available variables to find the variables that best explain the data.
How machine learning uses “trees”
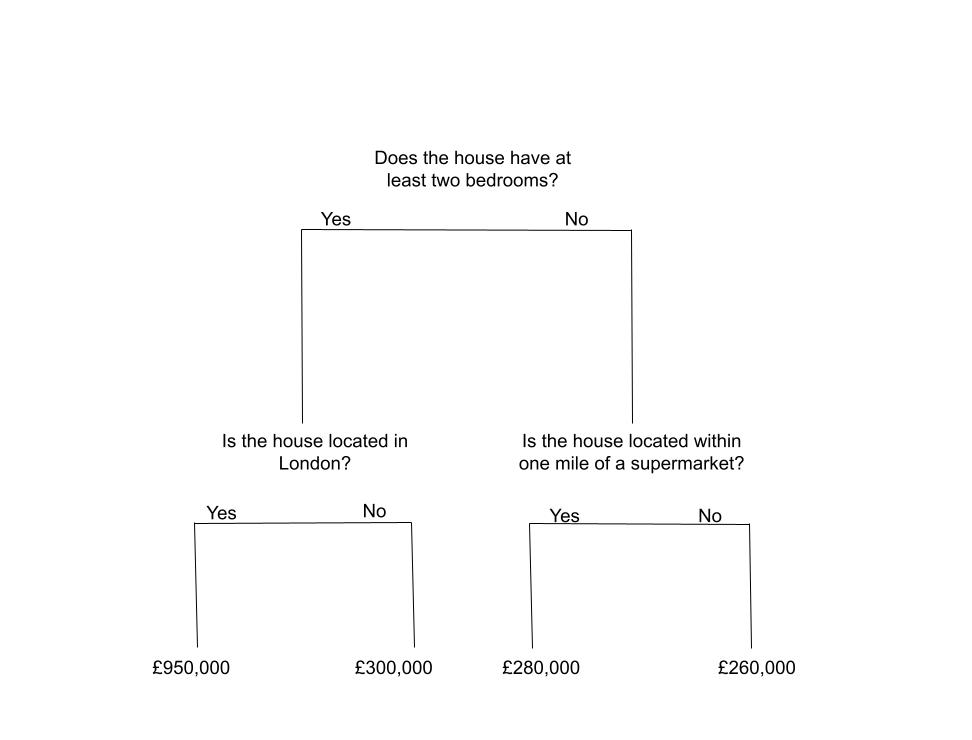
A regression tree is a type of decision tree. Essentially it gives different predictions for different categories of variable. For instance, if the number of bedrooms in a house is equal to 1, the average house price may be different compared to when the number of bedrooms are greater than 1.
The tree then divides these subgroups further. For example:
- Within the houses with at least two bedrooms, whether the location is in London may or may not determine house prices.
- Within the houses with only one bedroom, whether there is a supermarket nearby may or may not affect house prices.
This tree is shown below. The numbers represent average house prices in that subgroup (numbers are fictional and are there just as an example of how trees can work).

Machine learning is particularly helpful when we have so many possible variables to choose from. There are so many variables that could determine house prices, but machine learning helps us narrow down and focus on the most important variables.
There can be drawbacks to machine learning approaches. They can be more complex and hence more difficult to interpret. They are also data-hungry and require lots of computational power.
Machine learning is here to stay. It has delivered several insights already. Developing skills in econometrics, machine learning and related coding languages can be valuable alongside studying economics for the job market.
Further reading on econometrics
For those looking for books for their personal statement, or to get a head start on econometrics at university, here are a few reading recommendations:
- Mostly Harmless Econometrics or Mastering Metrics are both excellent introductions to econometrics, applied to many different microeconomic scenarios. Some theory and equations, so definitely for those with a statistical and mathematical aptitude.
- For a mathematical textbook for students starting undergraduate econometrics, the Wooldridge textbooks are the go-to for several universities. While too detailed and deep for a personal statement, this is a thorough and clear run-through of the key parts of econometrics. This can get technical very quickly though, so reading with a lecturer’s or tutor’s assistance is recommended.
- Most of the items above will not cover machine learning. For an economist’s perspective on machine learning, I’d recommend this if you’re into statistics / computer science. Be warned this is quite technical. So for beginners, I recommend focussing on the big picture rather than getting bogged down in the theory here.
For more related economics resources, click the blue button below: